With the pandemic firmly in the rearview mirror and massive capital projects underway at many North American airports, air traveler satisfaction is creeping up, according to the J.D. Power 2023 North American Airport Satisfaction Study.
That’s not to say challenges no longer exist. Indeed, the industry continues to face significant problems, such as the ongoing pilot shortage, weather delays and cancellations, route map contractions, and record volumes of travelers. Overall, though, travelers are happier in 2023 than in 2022.
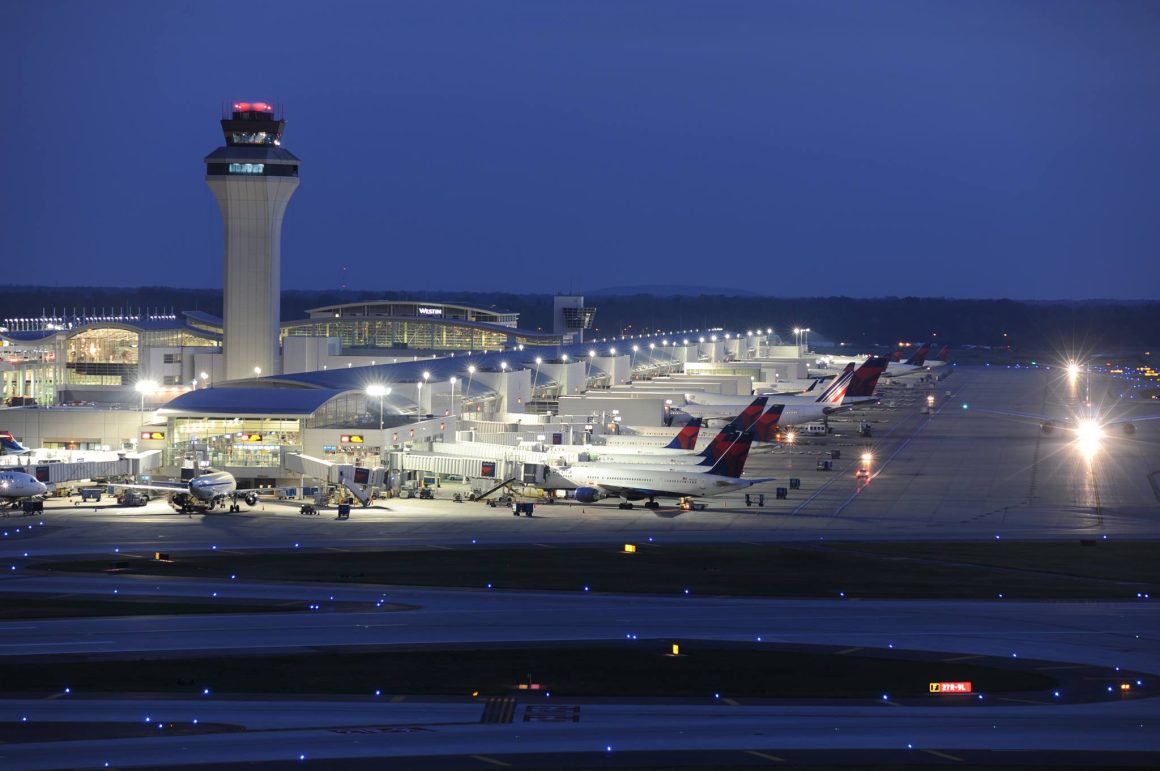
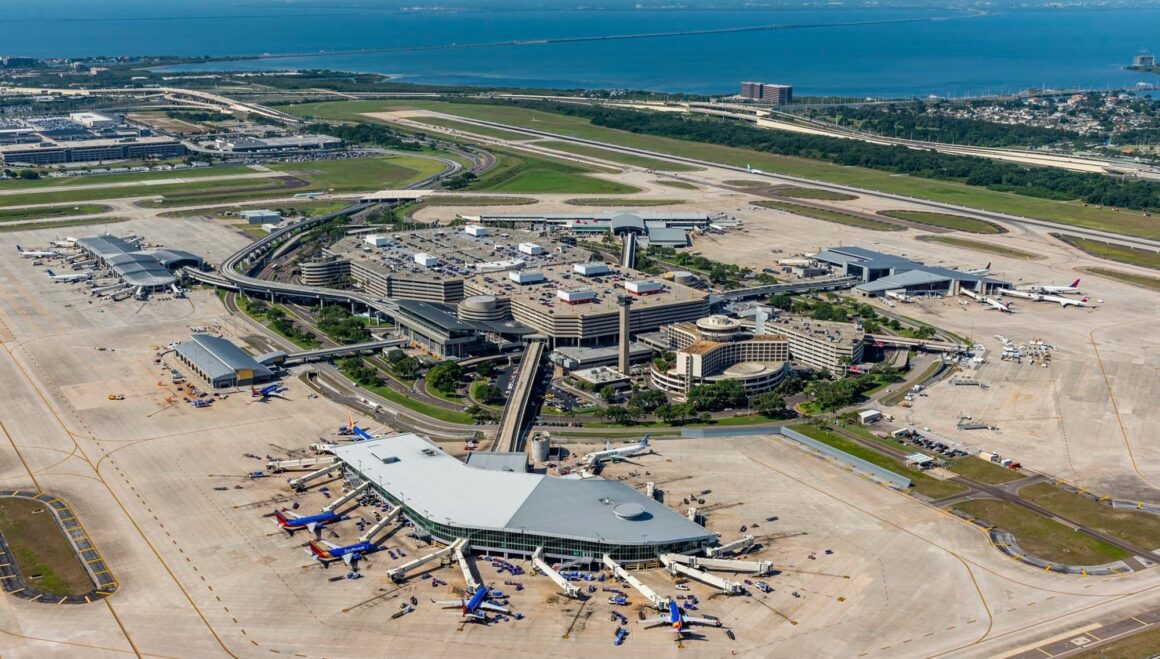
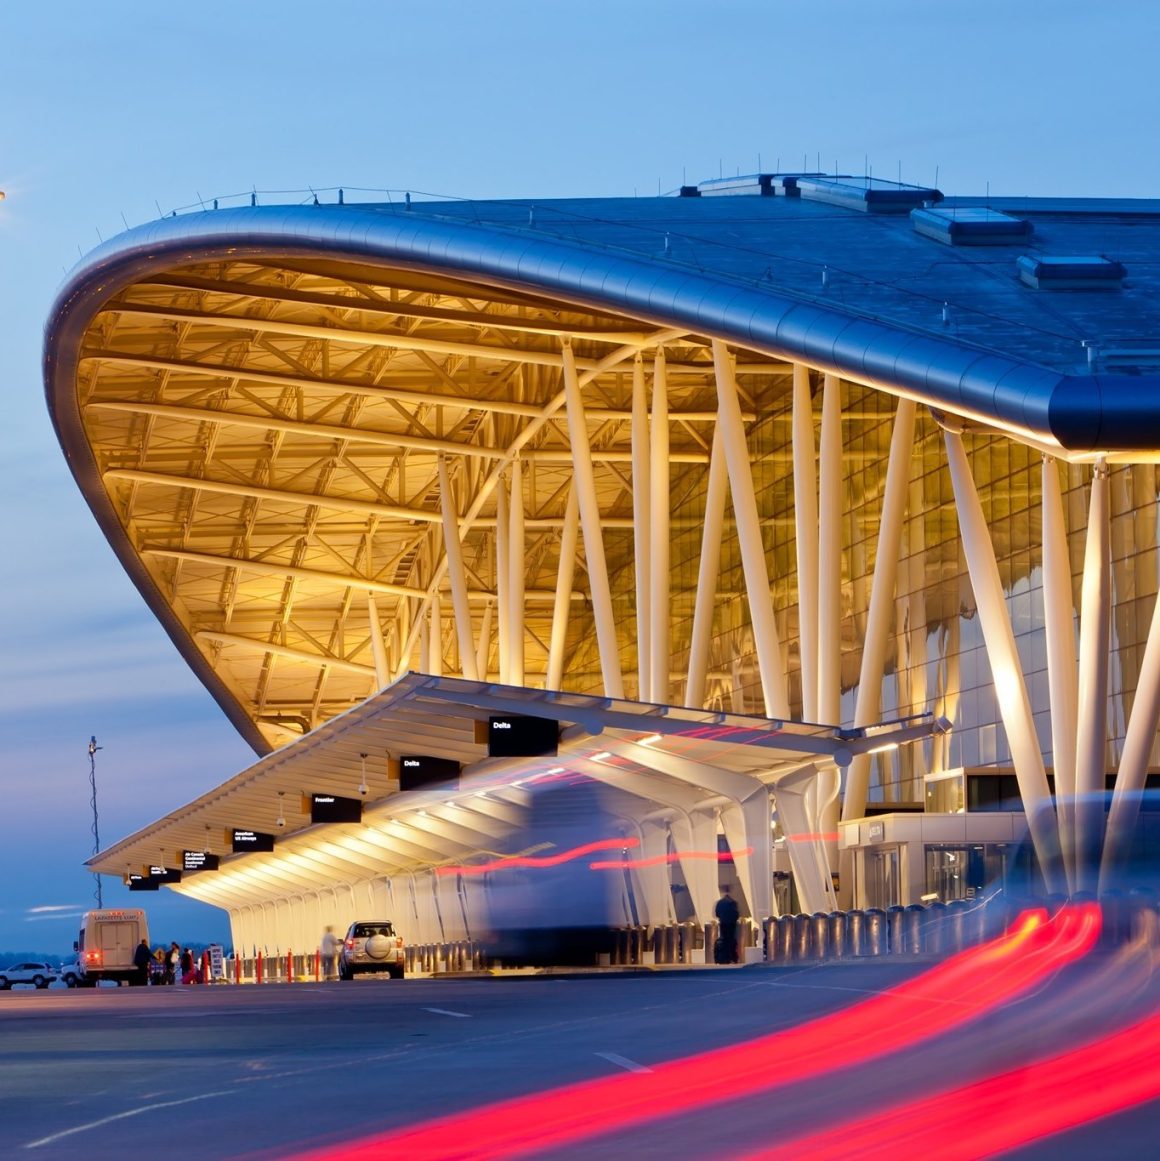
This year’s #1 airports include two incumbents and a newcomer. Indianapolis International Airport (IND) and Tampa International Airport (TPA) land in the #1 spot for the second consecutive year in the medium and large airport categories, respectively. However, in the mega airport category, last year’s winner – Minneapolis/Saint Paul International Airport (MSP) – was dethroned by fellow Delta superhub Detroit Metropolitan Wayne County Airport (DTW).
The Science Behind the Study
The 2023 J.D. Power North American Airport Satisfaction Study – now in its 18th year – is based on 27,147 completed U.S. or Canadian traveler surveys between August 2022 and July 2023. To qualify for the survey, travelers must have used at least one U.S. or Canadian airport – including connecting airports – during a roundtrip (one-way flights are not eligible for survey).
J.D. Power conducts the survey by measuring the satisfaction at North America’s busiest mega airports (>33M pax/year), large airports (10-32.9M pax/year), and medium airports (4.5-9.9M pax/year).
The study, which measured an average score of 780 (out of a possible 1000) for overall air traveler satisfaction, focuses on the following six factors:
- Terminal facilities
- Airport arrival and departure
- Baggage claim
- Security check
- Check-in (including baggage check)
- Food, beverage, and retail options
What the Study Tells Us About Air Travel in 2023
Following a mind-blowing 25-point drop in the number of happy travelers in 2022, this year’s survey saw a more modest three-point increase in satisfaction on a 1,000-point scale.
Michael Taylor, operating director of travel, hospitality, and retail at J.D. Power, says investments at North American airports – particularly related to post-pandemic food, beverage, and retail operations – are making a positive difference. But he acknowledges that there is still much more to do.
“There is still more [airports] could do to improve passenger experience while also improving their own bottom lines,” said Taylor. “Happy passengers spend a lot more money at the airport, so ongoing efforts to spread passenger volumes throughout the day and deliver superior service at all customer touchpoints will be critical.”
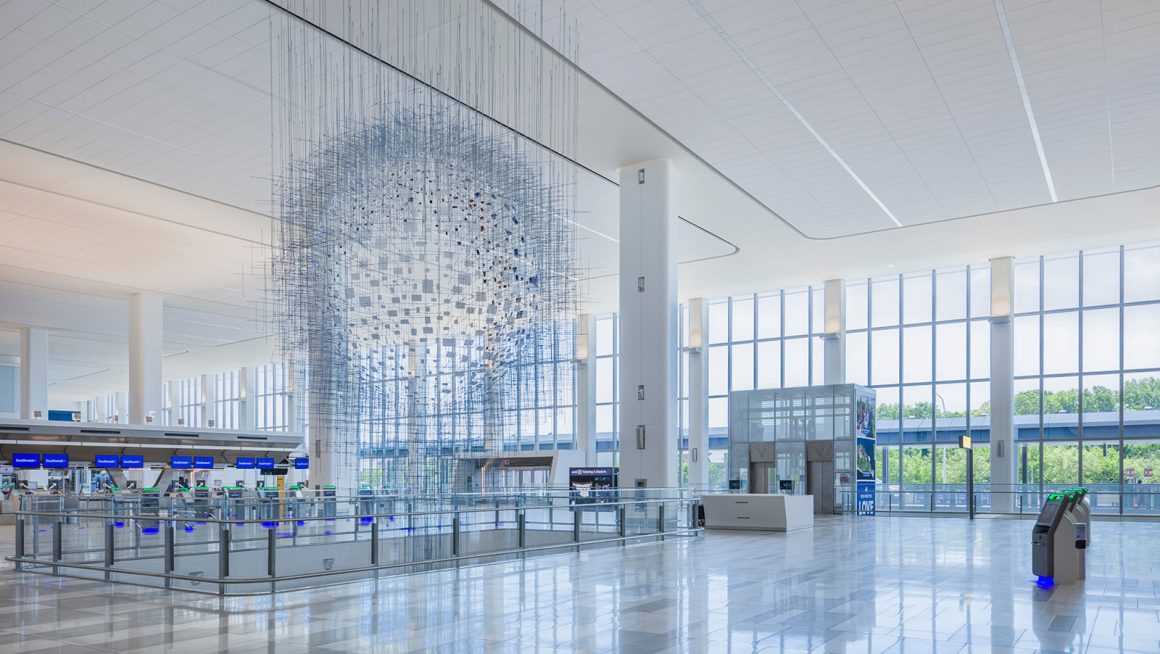
Of particular note was New York’s LaGuardia Airport (LGA), which saw an impressive jump to average (788) in the large airport category after spending years near the bottom of the list. We suspect LGA will continue to rise in the rankings when next year’s findings are released. Another airport that has undergone a massive transformation is Kansas City International Airport (MCI), which also ranks average (788) after being near the bottom of the list of large airports for years.
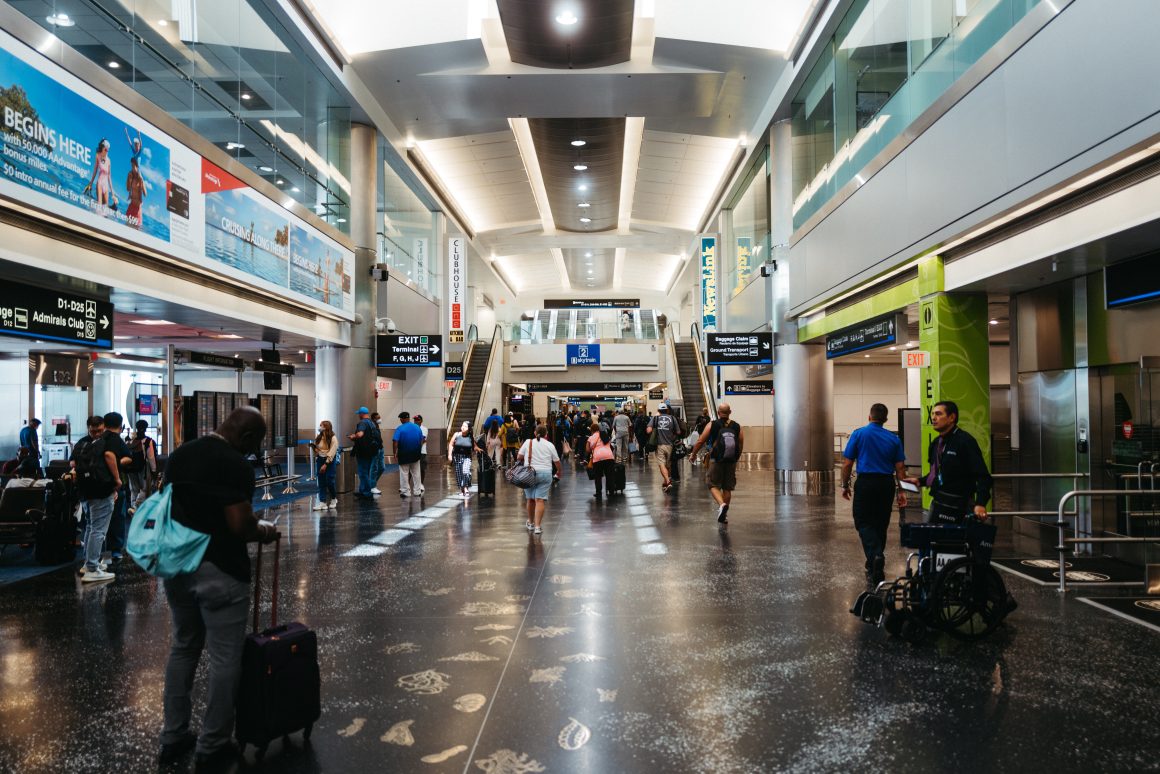
Additionally, the study notes that 60 percent of travelers reported severe or moderate crowding in airport terminals, which is two points higher than last year’s study.
As additional infrastructure projects improve airport experiences across North America, such as the major project underway at Pittsburgh International Airport (PIT), this list will likely vary in the coming years. However, we don’t see an end to overcrowding or the pilot shortage in the short term.
So, without further ado, here is the list of the top five best and worst mega, large, and medium airports in North America and their survey scores (out of a possible 1000 points). 2022 rankings are in parentheses following this year’s score.
Mega Airports (>33 million pax annually)
Top 5
- DTW – Detroit Metropolitan Wayne County Airport: 800 (3)
- MSP – Minneapolis-Saint Paul International Airport: 796 (1)
- LAS – Harry Reid International Airport: 787 (5)
- DFW – Dallas/Fort Worth International Airport: 783 (8)
MIA – Miami International Airport: 783 (9) - SFO – San Francisco International Airport: 781 (2)
Bottom 5
- EWR – Newark Liberty International Airport: 732 (1)
- YYZ – Toronto Pearson International Airport: 749 (5)
- SEA – Seattle/Tacoma International Airport: 754 (8)
- FLL – Fort Lauderdale-Hollywood International Airport: 762 (9)
BOS – Boston Logan International Airport: 762 (4) - ORD – Chicago O’Hare International Airport: 763 (2)
Large Airports (10-32.9M pax annually)
Top 5
- TPA – Tampa International Airport: 832 (1)
- SNA – John Wayne Airport, Orange County: 829 (2)
- SLC – Salt Lake City International Airport: 825 (6)
- DAL – Dallas Love Field: 820 (3)
- RDU – Raleigh-Durham International Airport: 813 (5)
Bottom 5
- PHL – Philadelphia International Airport: 750 (1)
- HNL – Honolulu International Airport: 753 (2)
- YUL – Montreal-Pierre Elliott Trudeau International Airport: 759 (6)
- OAK – Oakland International Airport: 768 (10)
- SAN – San Diego International Airport: 772 (14)
Medium Airports (4.5-9.9M pax annually)
Top 5
- IND – Indianapolis International Airport: 843 (1)
- RSW – Southwest Florida International Airport: 839 (4)
- ONT – Ontario International Airport: 834 (8)
- PBI – Palm Beach International Airport: 828 (7)
- ABQ – Albuquerque International Sunport: 827 (6)
Bottom 5
- OGG – Kahului AIrport: 771 (2)
- BUR – Hollywood Burbank Airport: 772 (1)
- BDL – Bradley International Airport: 789 (4)
- CLE – Cleveland Hopkins International Airport: 794 (3)
- OMA – Eppley Airfield: 804 (5)
To find out how your favorite (or not-so-favorite) airport fared in the study, check out the complete list in the J.D. Power 2023 North America Airport Satisfaction Study.